The classic measure for egg usage in the U.S. is per capita consumption. Calculated by the United States Department of Agriculture, per capita egg consumption provides a macro view of the market for eggs based on disappearance. Per capita consumption is essentially the number of eggs produced, plus beginning inventory and imports, less exports, and ending inventory all divided by the number of people in the U.S., according to Census Bureau data.
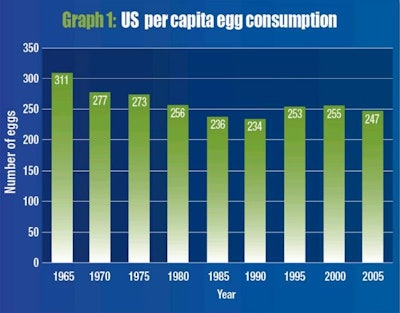
Per capita consumption of eggs has declined by approximately 170 eggs from 1970 to the mid 1990s (Graph 1). Joanne C. Ivy, president and CEO of the American Egg Board, said that egg consumption in the U.S. dropped largely due to concerns over dietary cholesterol. Ivy credits the work of the American Egg Board and the Egg Nutrition Center with the reduction in consumer concerns for cholesterol in eggs. Per capita consumption has increased slightly in the last 20 years, and it now stands over 10 eggs higher per capita than when it was at its lowest level.
The American Egg Board’s job is to support demand in the U.S. for eggs and egg products. In order to focus marketing efforts on specific channels of egg usage and distribution and track results, the industry needed to develop metrics that do more than just show total disappearance of eggs in the U.S. Ivy explained that they needed “meaningful metrics to measure demand trends in the egg industry. We wanted to go beyond per capita consumption, which we don’t believe accurately tracks demand trends in the marketplace.”
Three new metrics for egg demand
The American Egg Board has developed metrics that track retail shell egg sales, use of eggs and egg products in foodservice outlets, and the use of egg and egg products in home prepared meals, even if these meals are consumed away from home. Ivy said that efforts to develop a metric to track use of egg products as an ingredient for food manufacturers have been unsuccessful to date.
Retail egg sales
The metric for tracking retail shell egg sales is produced using Nielsen Scantrack and Homescan data. Scanner data and home diary research are combined to provide a picture of how many shell eggs were sold during the year. The number of eggs sold at retail increased by 5.9 percent from 2006 to 2011 to 2.69 billion dozen eggs. During this same six-year time period, the U.S. Census Bureau estimates that the population increased by 4.4 percent to 311.6 million people, and the USDA reports that per capita egg consumption dropped by 4 percent (Graph 2).
Foodservice egg servings
The NPD Group calculates a metric for egg servings at foodservice outlets by combining data gathered via surveys and diaries. Ivy stated, “This data reflects consumer purchase behavior in the away-from-home segment. It includes data for egg servings in restaurants as well as non-commercial operations.” Non-commercial operations include business and industry, lodging, military, hospitals, vending, senior care, colleges and universities, and secondary schools, but not primary schools. According to NPD Group data, the foodservice egg servings have increased by nearly five percent from 2006 to 2011.
In home egg use
Use of eggs in the home to prepare food eaten at home or taken from home to be eaten elsewhere is tracked by the NPD Group with consumer surveys. Ivy said, “Approximately 5,000 households annually are part of the research, and they write down everything the household has consumed for a two-week period. It is in a diary format using forms provided by the NPD Group. Food items tracked include everything the household has eaten, including all ingredients to make a dish or bakery item by brand, such as Campbell’s soup, Morton salt, Pillsbury flour, etc.”
According to NPD Group survey data, egg eating per capita have increased by 10.4 percent from 2006 to 2011. Ivy stated that egg eating increased to 79.4 in 2011, an increase of 6.6 percent over 2010.
Are things looking up for eggs?
Each of the three new egg usage metrics has a growth rate over the six year period of 2006 to 2011, which exceeds the U.S. Census Bureau’s 4.4 percent estimate for increase of the U.S. population in this time period. Egg products going into manufactured foods—like baked goods, ice cream, salad dressings, ect.—are the only egg usage segment not being tracked by one of these new egg demand metrics. Based on the rate of increase of in the three metrics and the U.S. population, one might expect that the per capita consumption of eggs would have increased by some small amount in these six years, but that isn’t the case. According to USDA data, per capita consumption of eggs actually declined from 257.8 in 2006 to 247.6 in 2011, a drop of nearly 4 percent.
In spite of a slight drop in per capita consumption of eggs over the last six years, Ivy said that the market for eggs in the U.S. is looking up. “Egg servings in the foodservice channel have gone up every year since 2006, save for 2009 when the U.S. was in the midst of a deep recession,” said Ivy.
“It’s also encouraging to know that despite the industry’s largest recall in 2010, and the recession that we seem to be still coming out of, the selling environment for eggs continues to get better and better. For instance, the number of Americans who agree that eggs are good for you, convenient and a good value have all increased since 2007. The number of Americans who believe eggs are too high in cholesterol is now 20 percent, down from 34 percent in 2008. This is great news as we’ve been able to effectively reduce one of the major barriers to consumption of eggs.”
The trends shown by the new demand metrics for eggs are being used to target market segments for advertising and promotion efforts. “These help to let us know if we are focused on areas where we are seeing growth and it helps to let us know if we are having an impact on the demand in that area,” Ivy said. “There is no one measure that is perfect, but taken together they help us to understand the egg demand picture.”