Reducing feed ingredient cost in poultry and swine diets while maintaining acceptable livestock performance is always foremost in the minds of nutritionists and feed formulators. Recent reports (Goodson et al. 2005) have shown that using actual amino acid values for formulation purposes can lead to significant savings in livestock diets.
For example, when just the amino acids lysine and methionine in corn and soybean meal were considered, the savings on a per ton basis still ranged up to about $1.50. Most poultry integrators will make a formulation change when savings are in the $0.20 to $0.35 per ton range, so the potential to save over a dollar per ton is significant. These calculations were based on a large data set of 2004 crop year corn and soybean meal samples. Amino acid levels used in other protein-containing ingredients in these example diets were set at average levels.
So, where do we get appropriate and accurate amino acid values for use in formulation matrices?
Regression equations based on moisture, crude protein
One of the fastest and easiest methods uses regression equations based on moisture and crude protein (CP). A large and diverse data set is required. The method relies on the measurement of each amino acid in a feed ingredient. When a large number of samples are analyzed to build the database, an equation is calculated comparing each amino acid to another nutrient, generally CP. This nutrient is used because amino acid content is closely and positively correlated with protein level. The relationship between CP and amino acid content works quite well for prediction of unknown samples in most ingredients.
 0611FMregression1
One exception that comes to mind is lysine in distillers dried grains with solubles (DDGS). In this case some lysine is rendered indigestible for the most part when subjected to heating conditions. Also, heat-damaged lysine does not show up in the classical wet chemistry lysine assay so lysine can be quite variable. A recent large amino acid data set, AminoDat® 3.0 (Degussa Corp 2006), contains the amino acid content as well as regression equations for many ingredients. In the case of DDGS, regression equations are available for seven amino acids. Lysine is not included due to the fact that, as shown in Figure 1, its content is too variable to yield a useful prediction. It should also be noted that the lysine in AminoDat® 3.0 ranges from 0.35 percent to 0.99 percent, which is a much broader range than the samples used here. Still the correlation of lysine and CP is not high enough to make a good prediction.
 0611FMregression1
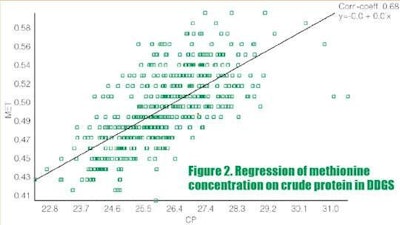
Figure 2 shows analyzed methionine values, plotted against the corresponding crude protein (CP) values. The regression equation for this fairly large data set (n=455) is Y= 0.019 + 0.018X with a correlation of 0.68. It is clear that while the correlation is fairly high, there is a spread of data around the least squares line. AminoDat® 3.0 includes a regression equation for the methionine in DDGS. This program has a higher correlation, 0.70, for methionine than the current data. This is certainly an adequate number to use for prediction, assuming actual sample analysis data are not available.
Threonine is also well-predicted. In this case the correlation between threonine and CP is 0.86. However, again using 26.4 percent CP we find an actual low threonine level of 0.92 percent while there is a high value of about 1.05 percent. Figure 2 contains a plot of the threonine data from the DDGS data set. However, inspection of the data reveals that the threonine concentrations vary widely from the regression line. AminoDat® 3.0 also contains a regression equation for threonine. The range of threonine levels in this program again cover a wider range than the data used here. The range is 0.80 to 1.18 percent.
 0611FMregression1
As a more practical example, a set of 455 DDGS samples was analyzed using classical wet chemistry methods in the Degussa Amino Acid laboratory. These samples were collected and analyzed between June 2004 and June 2006, so they are representative of the "new process" distillers. Figure 1 shows the lysine content of each sample plotted with its CP level. The correlation for this nutrient is 0.49, meaning that only 49 percent of the variation in lysine content is explained by changes in CP. This means other factors, probably heating, are influencing the lysine levels found in these samples. In this case using CP to predict lysine from unknown samples would not work well.
If we look at DDGS with about 26 percent CP, the lysine ranges from about 0.50 percent up to about 0.90. These estimates are too wide-ranging for cost effective feed formulation use. Lysine levels in DDGS show extreme variation, mostly due to heat damage. Heat-damaged lysine does not show up in a classical lysine wet chemistry analysis. In our data set, lysine ranged from a low of 0.40 percent to a high of 0.99 percent. It is interesting to note that while the lowest lysine level was found in the sample with the lowest CP, the highest lysine level0.99 percentwas found in the samples containing 28.11 percent CP, not the sample with the highest CP at 31.5 percent. Basically, this demonstration shows clearly that lysine in DDGS is not predicted well from CP.
Assuming that a sample of DDGS has a CP content of 26.4 percent, the calculated methionine level would be 0.494 percent. This point of course, lies right on the regression line. However, when we study the plot, (Fig. 2) it shows that at 26.4 percent CP, the lowest sample actually analyzed had a methionine content of 0.45 percent. At the same CP level, the highest sample had a methionine of about 0.55 percent. The value predicted by the regression equation is almost exactly half way between the highest and the lowest value. Using regression in this case provides valuable information for the feed formulator. However, the number generated may still be off the mark since we do not have an actual ingredient analysis number to work with. No doubt, regression prediction of amino acid content is a very useful tool; however, actual ingredient analysis provides much more accurate feed formulation information.
 0611FMregression4
In these broiler finisher examples, DDGS was used at a rate of 200 pounds per ton, which is normally the maximum recommended level in broiler diets (Noll, 2005). Distillers amino acid levels are shown in Table 1.
For purposes of these examples, a lysine level of 0.77 percent, which was the mean lysine of the DDGS sample set, was used. The only nutrients that were varied in the formulation system were methionine and threonine. The formulations are shown in Table 2.
 0611FMregression5
The formulation cost savings by using actual DDGS analysis of a low vs. high methionine and threonine product is $0.51 per ton. It can be seen in the table that the major change was in the amounts of methionine and threonine that were pulled into the formulations. Even if DDGS were used at a rate of 5 percent rather than 10 percent, significant cost savings could be achieved. This example only includes a change in amino acid analysis of a by-product ingredient used at a low level. Knowledge of the amino acid content in the corn, soybean meal and poultry by-product will have further impact on formulation cost and bird performance. The use of regression-derived amino acid contents for protein-containing ingredients is certainly better than using "book" values. In the case of these equations, the nutrient of interest is predicted from a known nutrient. Feed formulators are better off using actual ingredient analysis values. These values can come from traditional wet chemistry methods or the very rapid, near-infrared techniques. Calibrations to rapidly predict amino acid content are available for all the major feed ingredients used on a global basis. These calibrations predict rapidly and accurately all the amino acids important to poultry and swine nutritionists (Goodson et al, 2006).
While regression predictions of amino acids are popular in our industry, their use may be costing the poultry producer significant dollars due to over-formulation or losses in animal performance. The most current set of regression equations, based on large data sets from materials collected on a worldwide basis, can be found in AminoDat® 3.0. While these equations predict well, having up-to-date and accurate real amino acid content in the formulation matrix will improve bird performance as well as save dollars per ton.
