Feed formulation is based on the principle of matching animal requirements for major nutrients against the concentrations of nutrients in common feedstuffs.
For example, let's consider a group of pigs that require a diet with 0.85 percent lysine. We can easily formulate a simple diet based on 65 percent corn (0.25 percent lysine), 25 percent soybean meal (2.76 percent lysine) and 10 percent other ingredients devoid of lysine (for simplicity's sake.) In this example diet, corn and soybean meal contribute about 20 and 80 percent of total lysine, respectively. Even though corn is not considered a primary source of protein (lysine being the first limiting amino acid in any commercial pig diet), it still provides a significant part of the total concentration.
It merits mentioning that the lysine concentration values used above are based on average figures derived from analyses of a large number of samples found in the National Research Council’s Nutrient Requirements of Swine (NRC, 2012).
For example, 132 samples of corn and 28 samples of soybean meal were analyzed to provide the average concentrations of 0.25 and 2.76 percent lysine, respectively. Of course, not every corn or soybean meal sample is found to contain exactly 0.25 percent lysine. In fact, according to statistical analysis, 99 percent of those corn samples were found to be within the range of 0.13 and 0.37 percent lysine, as implied by the standard deviation (SD) of 0.04 percent lysine provided for corn in the same publication.
Examining standard deviations
Now, let's examine the value of the information enclosed within the SD statistic. First, it implies that based on the analysis provided, it is unlikely for any similar sample to contain exactly the average value. In other words, it is likely to deviate from it. How much? It is easy.
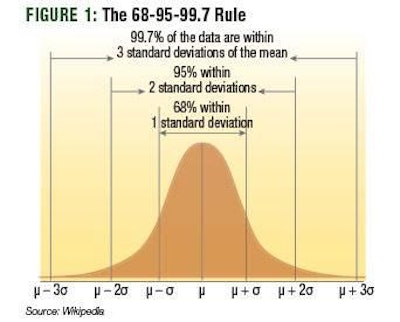
Sixty-eight percent of the time the actual concentration will fall within one SD up or down the average value; 95 percent of the time, it will be within two SD around the average, whereas, virtually all samples will be within a range of three times the SD around the average. And once in a while, it will even be way out of it.
Seen from another angle, it means every time we formulate a diet it is likely we will be around our target, up or down by a bit or by a far distance, but almost never at the exact value we aim for. That's the drawback of using natural ingredients with widely variable deviations in the concentration of major nutrients. In contrast, synthetic lysine will contain a relatively standard level of lysine (e.g., L-Lysine HCl contains 79.8 percent lysine with an insignificant SD), assuming there are no impurities.
Dealing with ingredient variability
There are several ways to work around the problem of natural variability, but for this discussion let's continue by examining the impact of ignoring the otherwise boring SD statistic on animal performance. To this end, we will assume we formulated the above diet using the average values as provided in the book, but the actual corn we used in the feed mill contained not 0.25 percent lysine as expected, but only 0.17 percent lysine (so it was marginally within two SD, representing 95 percent of the possible expected values).
With only 0.17 percent lysine in corn, our diet now contains 0.80 instead of 0.85 percent lysine; in other words about 6 percent less lysine compared to our target that was based on what animals required for maximal growth.
Is this small deficit that important? Considering that lysine is the first limiting amino acid -- this clearly demonstrates what limiting means -- we can safely say our pigs will now grow 6 percent less. (We will ignore the fact they might get fatter as this further complicates the discussion without offering anything to our conclusions.)
Had we been formulating the original diet for pigs between 50 and 75 kg body weight growing at 900 grams a day, with 6 percent less lysine in their actual feed, our pigs would require two extra days to reach their target weight. And, all this by an unfortunate batch of corn that was low in lysine -- the ingredient that no nutritionists think of as the most important in terms of lysine supply. Should the same mishap occur in our batch of soybean meal used in this example diet the effect would have been even greater. With a SD of 0.29 percent, an equally unfortunate batch of soybean containing lysine at two times the SD below average would result in a final diet with only 0.70 percent total lysine.
Of course, if these two mishaps happened together, we could end up with a very inappropriate diet, indeed. Perhaps, the examples used here are rather extreme, and sometimes when one ingredient is below average, the other is above, which helps ameliorate the problem, but that's just chance and more serious methods exist in addressing this problem. This discussion, however, served the purpose of illustrating the fact that natural variation in common ingredients is real, significant, and as it is largely ignored, it can explain quite often why some groups of animals fail to grow as predicted or grow unevenly from batch to batch even if formulas remain unchanged.
Replacing whey protein concentrate in piglet formulas