Retail prices of fresh meat and poultry played a major role in the results of the National Meat Case Study (NMCS) for 2015 with whole-muscle beef losing space in the fresh meat retail case to ground beef, pork and poultry.
Fresh meat packaging, at the same time, registered an increase in natural/organic labeling claims, more store branding and vacuum packaging. Organic meat product claims, for example, increased in 2015, with claims on chicken packaging up 6.7 percent.
Jerry Kelly of Sealed Air Corporation reported the NMCS results at the 2016 Annual Meat Conference.
Poultry, pork, ground beef make gains
During the period of weak consumer spending and rising meat prices from 2010 to 2015, the National Meat Case Study showed:
- Pork and turkey gained in the percentage of packages and pounds on display in the supermarket fresh meat retail cases surveyed.
- Chicken led all meats in gains in the percentage of packages and pounds on display in the U.S. club stores surveyed, with ground beef and pork also making gains.
- Poultry (chicken and turkey) and ground beef gained percent of linear feet of packaging in the fresh meat retail case at the expense of whole-muscle beef and lamb.

In a period when retail pricing rose 50 percent for beef, 40 percent for pork and 15 percent for chicken, consumers economized by buying less-expensive meats, and the NMCS reflects pork, chicken and ground beef benefited the most with percentage increases in numbers of packages and pounds of product displayed.
Less in fresh meat retail case in 2015
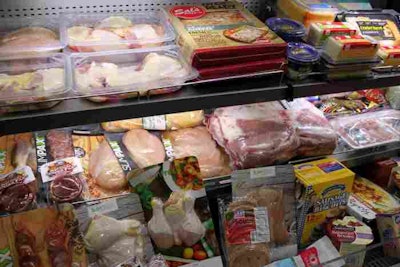
Audits of 114 supermarkets, supercenters, clubs and small-format stores in 24 states showed the average meat case in the second and third quarters of 2015 displayed 139 SKUs of fresh meats in 1,056 packages at a weight of 2,046 pounds.
Retailers displayed less fresh meat in their cases in 2015. From 2010 to 2015, the average weight of the meat in a package slipped from 2.0 to 1.9 pounds, and the average number of packages per linear foot in the meat case dipped from 5.8 to 5.0.
Beef the big loser in fresh meat case
The biggest loser in the fresh meat retail case was whole-muscle beef, which lost 9 percent in number of SKUs, falling from 46.9 percent to 37.9 percent. Ground beef, on the other hand, gained 2.1 percent in SKUs, rising from 12.8 percent to 14.9 percent.
Whole-muscle beef, similarly, lost percent of packages (-3 percent in supermarkets and -8 percent in club stores) and percent of pounds (-4 percent in supermarkets and -8 percent in club stores) and linear feet (-2 percent).
Meats that benefited from beef’s declines
The benefactors of beef’s slippage in the fresh meat case were pork, chicken, ground beef and turkey. However, these meats gained in the retail case in different ways; none made gains in all data. For example, pork made gains in percent of packages and pounds, but declined 2.1 percent in number of SKUs and registered no change in percent of linear feet in the fresh meat retail case.

Ground beef came closest to a sweep in positives in all parameters. While ground beef registered increases in percent of packages and pounds, it registered no change in percent of pounds in club stores.
Poultry meats register gains in packages, pounds
Chicken, on the other hand, showed more strength in club stores, registering no change in percent of packages and pounds in supermarkets but increases of 4 percent and 3 percent, respectively, in club stores. The survey reported that chicken’s SKUs rose 1.2 percent.

Turkey’s performance in the fresh meat retail case was mixed. Turkey had increases in percent of packages (2 percent) and pounds (1 percent) in supermarkets, but 1 percent declines in those measures in club stores. Turkey scored gains of 2 percent in packages per linear feet of the meat case and 1.8 percent in share of SKUs.
Rise in meat branding in 2015
Meat branding gained significantly from 2010 to 2015 as follows:
- Supplier brands rose from 37 percent to 46 percent
- Store brands increased from 36 percent to 51 percent
- No brands declined from 27 percent to 4 percent
More production claims in 2015
Production claims for meats surged in 2015 compared with 2010, with the following being reported:
- Natural claims rose from 32 percent to 38 percent
- Organic (USDA Organic) claims increased from 0.9 percent to 3.8 percent

Vacuum packaging of meats increases
Vacuum packaging of meat increased from 17 percent in 2010 to 24 percent in 2015. PVC wrap declined from 42 percent to 33 percent. Other packaging types showed no significant changes.
Meat with the most packages, SKUs
Chicken had the most packages on average in retail meat cases at 303. But the study reports whole beef and ground beef separately. Combining both beef components reveals the meat with the most packages to be beef at 402.
By any measure, beef registered the greatest number of SKUs – 42 whole-muscle beef and 17 ground beef.
The National Meat Case Study reported the following averages for numbers of packages and SKUs by protein in stores surveyed in 2015:
- Beef – 230 packages and 42 SKUs
- Ground beef – 172 packages across 17 SKUs
- Pork – 219 packages across 31 SKUs
- Chicken – 303 packages across 31 SKUs
- Turkey – 96 packages across 12 SKUs
Meat performance comparisons in the study are influenced by the breakout of ground-from, whole-muscle beef, while the chicken, turkey and pork categories include ground products. In 2010 to 2015, price differentials undoubtedly play a role in the results, with ground beef and poultry being significantly cheaper per pound.