Maro Ibarburu, Program Manager for the Egg Industry Center located at Iowa State University, released the October-November statistical report on December 6, which was prepared in collaboration with Don Bell of the University of California at Riverside. The full report with tables and figures can be accessed by emailing [email protected].
It is evident that the industry is returning to improved profitability as the rise in Urner Barry price has offset recent escalation in feed costs.The volume of shell eggs reaching the market has been restrained by premature depletion of flocks and diversion as a result of 45-week confirmation of infection with SE. The major trends over the past month are noted in the statistics extracted from the EIC monthly report.
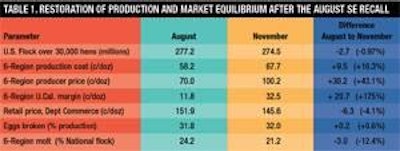
Table 1 highlights the comparisons in egg price, flock size and production cost between August, reflecting the pre-SE period and November which hopefully denotes long-term recovery. The effects of the SE recall extended from late August through mid-October with a switchback trend in price showing a swing of 75 cents per dozen.
The current report as distributed by the EIC is summarized for readers of Egg Industry. It is emphasized that data generated using models which are appropriate in times of relative stability loose predictive accuracy during short-term market turmoil.
- The U.S. estimated (6-Region) cost of production for November 2010 was 67.7cents per dozen ex farm, which is 2.3 cents per dozen or 3.5% more than in October. The range in production cost among regions extended from 63.1 cents per dozen in the Midwest to 71.8 cents per dozen in California.
- The margin represented by “income minus cost” for November attained 34.3 cents per dozen compared to only breakeven in October and a negative margin of 17.7cents per dozen in September. The current more favorable situation is due to the 56% increase in UB price offsetting the 3.5% increase in production cost. For the first eleven months of 2010 the average margin attained 8.1 cents per dozen.
- In evaluating the breakeven margin for November it was noted that feed cost was 43.4 cents per dozen, with pullet depreciation at 9.6 cents per dozen and other fixed and variable costs amounting to 14.7 cents per dozen, applying the standard EIC cost factors. These values other than the feed and pullet categories remained unchanged through the first ten months of 2010.
- Producers attained a farm profit of 34.3 cents per hen housed based on November costs and revenue, compared to a breakeven situation in October and a loss of -32.7 cents per bird in September. This month demonstrated the greatest impact from the recall. The cumulative eleven-month contribution per hen now stands at 166.9 cents.
- The UB simple average producer price for six U.S. regions, assuming 80% large grade eggs, was 100.2 cents per dozen for November compared to 61.6 cents per dozen in October 2010. The eleven-month cumulative simple average UB price was 67.8 cents per dozen. The range over the six reported regions was 99.0 cents per dozen for the Midwest to 103.2 cents per dozen for the South Central Region.
- The USDA-AMS determined an ex farm price of 109.3 cents per dozen for November compared to 66.10 cents per dozen in October. Corresponding warehouse/distribution center and store delivery prices were 124.8 cents per dozen and 130.3 cents per dozen respectively. The farm-to-store spread was 20.95 cents per dozen which was appreciably higher than the value of 16.95 cents per dozen in October.
- In reviewing retail prices for table eggs, the Bureau of Labor Statistics and the Department of Commerce estimated an October average of 145.6 cents per dozen, 17.0% lower than the October 2010 value of 175.3 cents per dozen. The simple average retail egg price for the first ten months of 2010 was 164.5 cents per dozen.
- The Large-to-Medium grade white egg price spread over six regions was 36.1 cents per dozen in November compared to 20.2 cents per dozen in October with an average spread of 21.2 cents per dozen during the first eleven months of 2010. Regional spreads ranged from 34.7 cents per dozen in both the North West and Midwest to 38.8 cents per dozen in the South Central Region. The average spread for the six regions widened by 78.7% compared to values for October.
- During November 2010, layer feed averaged $251.00 per ton, which is 18.1% higher than the eleven-month average of $213.00 per ton based on six regions. During November the price range among regions was $228.80 per ton in the Midwest rising to $272.00 per ton in California. The differential of $44.00 per ton is equivalent to approximately 76.7 cents per dozen applying realistic industry production parameters.
- During the first eleven months of 2010, the volume of commercial-egg strain eggs in incubators has remained almost constant at an average of 38.85 million (compared with 36.35 in 2009) with a range of 33.4 million in August to 42.9 million in April.
- Straight-run hatch for October attained 41.3 million with an average for the first nine months of 2010 at 41.39 million.
- Projections for pullets to be housed in future months based on the five months-previous hatch and incorporating a 5% mortality factor, includes a range in the increase in placements from 15.75 million pullets in April to 21.44 million pullets in September 2010. The 12-month average of 18.21 million pullets per month for 2010 is 5.5% greater (1.0 million pullets) than the 12-month average of 17.26 million per month for 2009. The 2006 to 2010 monthly average was 16.30 million pullets placed each month. March 2011 placement will be 18.62 million, which is 0.6% higher than the 3-month average of 17.8 million for the first quarter of 2011 and a value of 17.2 million for the corresponding quarter in 2010.
- For October 2010, the USDA-NASS estimated the national flock at 279.0 million hens, which is 1.8 less more than in September 2010. Applying the University of California model based on USDA-NASS data for chickens and eggs, it is estimated that the December 2010 flock will attain 281.8 million hens.
- The University of California estimated the national flock at 278.9 million for November, down 4.1 million (1.5%) from September 2010. This decline is attributed to depletion of SE positive flocks with insufficient time to increase replacements although extensive retention of SE-negative flocks is evident.
- As at the end of October 2010, 21.2% of the national flock was over 72 weeks of age. With the exception of March 2010, which was an aberration at 26.0%, the seasonal pattern of a decline in molted flocks from January through April appears to be holding although this may be affected by depletion of SE positive flocks. For the entire year of 2009, an average of 24.7% of the national flock had been molted compared to 31.7% in 2008.
- During October 2010 USDA-FSIS data indicated that 5.0 million hens were processed compared to a ten-month average of 5.8 million hens. The FSIS value does not take into account any depleted flocks which are buried, rendered or shipped to Canada.
- Six regions reported a simple average of 24.5% molted hens in November, down 5% from October 2010. The actual proportion of molted hens in the U.S. varies widely, from 10.2% in the North East to 33.5% in California. The eleven-month average of 31.5% molted hens in the U.S. flock and differences among regions reflect production costs, revenue for eggs and realization value for spent hens.
- According to projections developed by the University of California, the most recent estimate of the National table-egg flock for October 2010 is 278.9 million hens. This number is expected to increase steadily to 281.6 million in December 2010, rising to 282 million by mid-year 2011 and 291 million by the end of the year. Given current surveillance programs as mandated by the FDA, national flock size could be trimmed further by depletion following evidence of SE infection or if consumer demand is depressed following additional recalls. Compensatory increases in flock size by retention of known SE-negative flocks may occur in regions or for specialty product subject to available capacity including re-caging. Although U-B prices during mid-November through early December reverted to pre-recall projections, a depression in price would be expected following any additional identification of SE. A decline in consumption consequential to adverse publicity would inevitably result in a decrease in hen numbers since flocks will be depleted at a rate faster than projected.
- The University of California projected an UB Large Midwest price of 142.4 cents/dozen for November which was exceeded with an actual value of 144.1 cents per dozen as a result of decreased availability of shell eggs due to depletion and diversion. The latest projection for December is 142.9 cents per dozen, contingent on current trends in flock depletion and consumer demand. It is reiterated that each 10 cent per dozen difference between forecast and actual UB price is equivalent to $30 million per month over 165 million hens producing generic eggs. The prospect for a rise depends on there being no further substantial recalls, reinforced by positive media reports confirming that the problem of SE is contained and is not a general reflection on the industry and the safety of our product.
- In October the top six egg-producing states with 157.7 million hens (159.3 million in September) represented 57.5% of the total of 274.5 million hens in flocks above 30,000 hens. In descending order these states are Iowa [18.9% of total], Ohio [10.1%], Indiana [8.1%], Pennsylvania [8.2%], California [7.0%], and Texas [5.0%]. States reporting to the USDA-NASS, represent 98.4% of all hens producing table eggs. It is evident that a disproportionate cull of SE-positive hens occurred in Iowa and Indiana since state totals have decreased by 2.5 million and 0.5 million respectively since August. The value for November confirms a reduction of 2.7 million hens since August although industry observers estimate a higher rate of depletion with estimates of up to 4 million hens.
- The rate of lay for the first ten months of 2010 attained 76.1%. This is higher than in 2009 during which an average of 75.8% was recorded. Average rate of lay is a function of weighted flock age and is also influenced by climatic conditions.
- During October 2010, 5,842 million cases of eggs were broken under Federal inspection, which is 11.2% lower than in September and virtually the same as in August 2010. During October 32% of shell eggs produced were broken compared to 28.3% during September. For the first ten months of 2010, egg breaking was up by 3.2% over the corresponding period in 2009. For the year to date, 32.0% of the 180.44 million cases produced were broken compared to 30.8% for the entire year of 2009. It is noted that on a year-to-year basis the proportion of eggs broken has shown a steady decline from the 2005 high of 35.1% to a projected value of 30% for 2010. Breaking should remain at a high level until flocks affected with SE are depleted. Premature disposal of flocks is occurring as unit breaking revenue has declined precipitously for this class of eggs
- The revised egg consumption value for 2010 is projected by the USDA-ERS to be 248.5 per capita, almost 0.3%, higher than the 247.7 eggs per capita recorded in 2009. Over the past seven years the highest per capita consumption of 257.8 eggs was recorded in 2006. Values for the third quarter of 2010, presently estimated at 62.2 eggs per capita were revised upward to 64.1 per capita but may have to be revised downward in response to the adverse publicity associated with the SE recall during mid to late August and carrying over to September. The efforts of the American Egg Board in mounting a positive campaign promoting egg consumption and a less aggressive media initiative by the FDA should contribute to projected value for the fourth quarter provided that there are no additional recalls.
- During September 2010 the USDA-FAS recorded exports of 263,000 cases of shell eggs contributing to a nine-month total of 1,729,000 cases representing 1.0% of U.S. production. Major importers during 2010 to date were Hong Kong/PRC at 44.1% and Canada taking 32.7% of shipments. Shell eggs represented 31.6% of total exports to date.
- Combined exports of shell eggs and egg products expressed as “shell-egg equivalents” attained 5,141,900 cases for the first nine months of 2010, representing 3.18% of U.S. production. The cumulative export of egg products has been 29% higher in 2010 to date compared to the corresponding period in 2009. Major importers during 2010 have been Japan (23.7%), Germany (20.2%), Canada (11.9%) and Mexico (4.5%).