Maro Ibarburu, program manager for the Egg Industry Center, located at Iowa State, released the December/January Statistical Report on February 13, 2011, which was prepared in collaboration with Don Bell of the University of California at Riverside.
It is evident that the industry is returning to traditional seasonal prices with the post-Christmas decline apparent. The volume of shell eggs reaching the market may still be restrained by premature depletion of flocks and diversion as a result of 45-week and post-molt confirmation of infection with SE in individual flocks.
The outstanding factor influencing profitability is the precipitous increase in the price of corn which is nudging $7 per bushel. Layer feed increased by 6.4% across the six-regions surveyed by the USDA between December 2010 and January 2011. An insightful article by Dr. Paul Aho, a distinguished economist, on future trends in ingredient prices will appear in Feed Management, a sister publication of WATT, and can be accessed here.
The current report as distributed by the EIC is summarized for readers of Egg Industry. The major trends over the past month are noted in the statistics and comments:
- The U.S. estimated (6-Region) cost of production for January 2011 was 74.3 cents per dozen ex farm, which is 4.9 cents per dozen or 7.1% more than in December 2010. The range in production cost among regions extended from 69.3 cents per dozen in the Midwest to 77.6 cents per dozen in the South East. This value was fractionally higher than for California at 77.4 cents per dozen.
- The negative margin represented by “income minus cost” for January 2011 attained -8.3 cents per dozen compared to a positive 23.1 cents per dozen in December 2010 and 30.7 cents per dozen in January of 2009. For 2010 the average algebraic margin attained 9.4 cents per dozen with negative margins in May, June and July (seasonal summer lows) and in September (SE recall).
- In evaluating the breakeven margin for January it was noted that average feed cost for the six regions was 49.6 cents per dozen, with pullet depreciation at 10.2 cents per dozen and other fixed and variable costs amounting to 14.7 cents per dozen, applying the standard EIC cost factors. These values other than the feed and pullet categories remained unchanged through 2010. It is evident that escalation in ingredient prices will be the most significant challenge to attaining profitability in 2011.
- Producers attained an ex-farm loss of -8.3 cents per dozen corresponding to -15.9 cents per hen housed based on January 2011 costs and revenue. For 2010 ex-farm profit was 9.4 cents per dozen or 232.6 cents per hen.
- The UB simple average producer price for six U.S. regions, assuming 80% large grade eggs, declined 22.8% to 74.5 cents per dozen for January 2011 compared to 96.5 cents per dozen in December 2010. The 2010 cumulative simple average UB price was 70.2 cents per dozen. The range over the six reported regions for January 2011 was 72.6 cents per dozen for California to 77.4 cents per dozen for the South Central Region.
- The USDA-AMS determined an ex-farm price of 80.3 cents per dozen for January 2011 compared to 106.7 cents per dozen in November. For February 2, the USDA price had increased to 99.5 cents per dozen. Corresponding warehouse/distribution center and store delivery prices in January 2011were 100.2 cents per dozen and 105.6 cents per dozen respectively which was approximately 19% lower than the previous month. The farm-to-store spread was 25.34 cents per dozen which was 7% higher than the value of 23.67 cents per dozen for the previous month. Average ex-farm price for 2010 was 76.8 cents per dozen which is 6.2% higher than in 2009.
- In reviewing retail prices for table eggs, the Bureau of Labor Statistics and the Department of Commerce estimated a December average of 179.3 cents per dozen, The simple average retail egg price for 2010 was 166.4 cents per dozen.
- The Large-to-Medium grade white-egg price spread over six regions was 15.1 cents per dozen in January compared to 40.5 cents per dozen in December with an average spread of 22.8 cents per dozen during 2010. Regional spreads in January ranged from 12.7 cents per dozen in the North East to 18.0 cents per dozen in the South Central Region. The average spread for the six regions was 29% indicating a restoration to normality compared to the unusually high values during the immediate months after the SE recall.
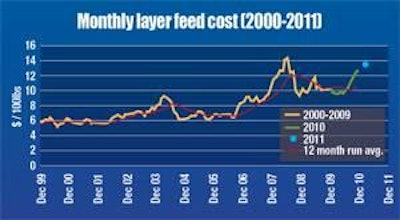
- During January 2011, layer feed averaged $275.00 per ton, which is 6.4% higher than the $258.40 per ton average based on six regions during December 2010. During January the price range among regions was $253.50 per ton in the Midwest rising to $295.10 per ton in the S. Atlantic region, exceeding California at $292.60/ton. The differential of $41.60 per ton is equivalent to approximately 67.3 cents per dozen applying realistic industry production parameters.
- In January 2011, there were 38.7 million commercial egg-strain eggs in incubators. During 2010, the volume of commercial-egg strain eggs in incubators remained almost constant at an average of 38.73 million (compared with 36.57 million in 2009) with a range of 33.4 million in August to 42.9 million in April 2010.
- Straight-run hatch for December 2010 attained 37.9 million chicks with an average for 2010 of 40.9 million chicks.
- Projections for pullets to be housed in future months based on the five months-previous hatch and incorporating a 5% mortality factor, included a range in the increase of placements from 15.75 million pullets in April to 21.44 million pullets in September 2010. The 12-month average of 18.21 million pullets per month for 2010 is 5.5% greater (1.0 million pullets) than the 12-month average of 17.26 million per month for 2009. The 2006 to 2010 monthly average was 15.96 million pullets placed each month. The total for January to May 2011 will be 88.2 million pullets, which is 3.3% higher than the corresponding 5-months of 2010.
- For December 2010, the USDA-NASS estimated the national flock at 289.5 million hens, which was virtually unchanged from November 2010. Applying the University of California model based on USDA-NASS data for chickens and eggs, it is estimated that the January 2011 flock will attain 285.4 million hens, rising to 289.2 million in December 2011, with a low value of 283.3 million hens in July.
- As at the end of December 2010, 22.4% of the national flock was over 72 weeks of age. The seasonal pattern of an increase in molted flocks from October through December was different during the third quarter of 2010. In 2009 the proportion of second-cycle hens in the national flock was 24.7% (31.1% in 2009) compared to a range of 22.1% to 22.4% for the period September to November. This may reflect the disinclination to molt flocks based on potential return from prevailing egg prices and feed costs. An alternative may be that some flocks have been identified as SE positive immediately prior to molt or at resumption of production resulting in depletion, reducing the number of older hens in the national population. For 2010 an average of 23.6% of the national flock had been molted compared to 24.7% during the corresponding period in 2009.Six regions reported a simple average of 24.0% molted hens in December, down 2% from November 2010. The actual proportion of molted hens in the U.S. varies widely, from 9.5% in the North East to 34.0% in California. An average of 23.9% molted hens was recorded in the six-regions during 2010. Differences among regions are attributed to production cost, revenue for eggs and realization value for spent hens.
- During December 2010, USDA-FSIS data indicated that 5.6 million hens were processed compared to 4.1 million in November 2010. The FSIS value does not take into account any depleted flocks which are buried, rendered or shipped to Canada.
- The University of California projected an UB Large Midwest price of 103.5 cents/dozen for February 2011. The lowest projection for 2011 is 83.5 cents per dozen in May with a November/December price forecast of 120 cents per dozen. Projections are contingent on current trends in flock depletion and consumer demand. It is reiterated that each 10 cent per dozen difference between forecast and actual U-B price is equivalent to $30 million per month over 165 million hens producing generic eggs.
- In December, the top six egg-producing states with 161.11 million hens represented 57.8% of the total of 280.2 million hens in flocks above 30,000 hens as recorded by the USDA. In descending order these states are Iowa [18.7% of total], Ohio [10.0%], Indiana [8.2%], Pennsylvania [8.5%], California [7.0%], and Texas [5.1%]. States reporting to the USDA-NASS represent 98.4% of all hens producing table eggs.
- The rate of lay for 2010 attained 76.3%. This is 0.5% higher than in 2009 during which an average of 75.5% was recorded. Average rate of lay is a function of weighted flock age and is also influenced by climatic conditions.
- During December 2010, 5,891 million cases of eggs were broken under Federal inspection, which is 4.8% higher than in November but 10% less than September. This peak month of 2010 (6582 million cases) followed the diversion of eggs from flocks infected with SE. In 2010 breaking was up by 3.9% over the corresponding period in 2009. For the year to date, 31.8% of the 217.4 million cases produced were broken compared to 30.8% for 2009. It is noted that on a year-to-year basis the proportion of eggs broken has shown a steady decline from the 2005 high of 35.1% to a projected value of 30% for 2010.
- For the last quarter of 2010, 17.224 million cases were broken compared to 16.397 during the same period in 2009. The difference of 0.827 million cases over the 4th Quarter of 2010 represented the output of an average of 4.2 million hens in production which were presumably infected with SE, requiring diversion to breaking.
- The revised egg consumption value for 2010 estimated by the USDA-ERS was 246.6 per capita, or 0.45% lower than the 247.7 eggs per capita recorded in 2009. Over the past seven years the highest per capita consumption of 257.8 eggs occurred in 2006. The efforts of the American Egg Board in mounting a positive campaign promoting egg consumption contributed to maintaining projected consumption during the fourth quarter of 2010 although consumption was markedly depressed in September and part of October as a result of the SE recall. It remains to be seen whether the press releases by the AEB concerning the revised cholesterol content of generic product to 185mg per large grade egg will enhance consumption.
- During November 2010, the USDA-FAS recorded exports of 205,600 cases of shell eggs contributing to an eleven-month total of 2,204,000 cases representing approximately 1.1% of U.S. production. Major importers during 2010 to date were Hong Kong/PRC at 40.2% and Canada taking 27.0% of shipments. Shell eggs represented 34.9% of total exports to date.
- Combined exports of shell eggs and egg products expressed as “shell-egg equivalents” attained 6,307,000 cases for the first eleven months of 2010, representing 3.2% of U.S. production. The cumulative export of egg products was 29.6% higher in 2010 to date compared to the corresponding period in 2009. Major importers during 2010 were Japan (23.0%), Germany (19.0%), Canada (12.6%), S. Korea (6.0%) and Mexico (3.9%).