One effect of the increasing industrialisation of the pig business internationally is that animal numbers have become better documented, especially those of breeding sow populations in the different countries around the world. The data on sows now available for 2006 tell a story of a period of stabilisation after earlier increases.
We have described before how sow numbers appear to be relatively resistant to the normal fluctuations in pig prices. In the recent past they have stayed level despite some reductions in profitability. The 2006 data indicate that the opposite is also true, that a time of rather good producer returns in many countries has not brought big rises in their national pig breeding herd.
A bigger challenge awaits, in the form of the higher feed costs now taking effect because of more expensive grains. Some downward adjustment in sow numbers is expected in the national herds of a number of the places listed in Table 1.
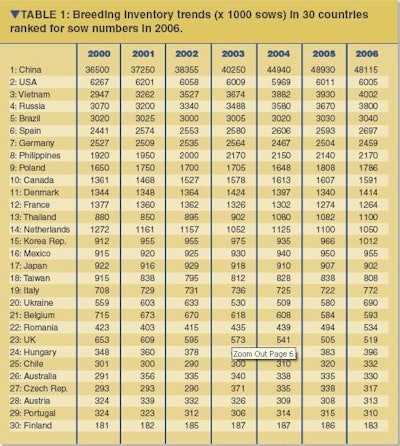
This Table represents the latest indication from our exclusive database on world sow numbers. It sets out the 30 countries we believe to have the largest sow populations and ranks them for size in 2006, with a guide to the changes in inventory they have undergone since the year 2000.
In terms of position on the list, the most notable entry is that for Vietnam in 3rd place. A year ago, we had put Vietnam at Number 4. At the time it was ranked between Russia and Spain. Now both of those countries have dropped back, while Brazil is another to have moved higher.
Previously we have published only a Top 10 of countries for sows. Extending it to the largest 30 allows the inclusion of more entries particularly from the newly enlarged European Union. Other data has been released recently from EU statistical bureau Eurostat on the pig breeding structure in the 27 member states and also in Norway. Our analysis presented in Table 2 examines these 28 industries for the 2 most recent years in Eurostat's structural record, 2003 and 2005.
Rather than listing the states alphabetically, for easier examination we have chosen to list them according to the proportion of their sow inventory present in herds of more than 200 sows in 2005. This is the largest category in the Eurostat dataset. Despite being comparatively small by modern standards, it still manages to demonstrate a marked (and sometimes quite surprising) structural contrast that persists between one country and another.
Moreover, Table 2 highlights the fact that many thousands of herds are involved in piglet production in the European Union, even after the consolidation that has affected the most mature industries worldwide. The Table lists over 16.5 million sows in more than a million EU herds in 2005. Previous data made available to PIG INTERNATIONAL by Eurostat had shown that, out of 818 330 herds with sows in the then EU-25 in 2003, only 1490 contained at least 1000 sows. From Table 2, by the end of 2005 the total number of sow herds in those 25 countries had fallen to 702 840.