Despite a series of difficulties ranging from huge ingredient price rises to serious animal disease outbreaks, total industrial feed manufacture in 2007 still managed to climb. Now, preliminary indications suggest that 2008 has once more defied the odds and registered a significant growth in world feed volumes.
Whereas the increase from 2006 to 2007 had been put at around 3.5%, the expansion of production in 2008 is anticipated to be around 2.9%.
An increase in feed production is nothing short of amazing, considering poultry and livestock producers in many countries have had to struggle against a thin or non-existent margin between costs and prices. It's important to note that the analysis comes too early to take full account of the impact on the global demand for animal proteins, that is being forecast to arise from the crisis affecting financial markets internationally. The depth of the crisis and the first signs of a recession in the national economies of a number of leading countries did not become clear until the second half of the year.
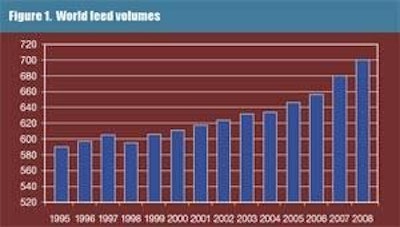
Figure 1 illustrates the trend that has taken world-feed volumes from just over 610 million metric tons in 2000 to pass 700 million metric tons for the first time in 2008. Our actual estimate for production last year is 700.1 million metric tons, up from an annual total of 680.4 million metric tons for 2007.
Therefore, it seems from our database that the global output of feeds for farm animals and fish has grown by nearly 18% in the last 10 years and by almost 15% since 2000.
Inevitably, the overall view is influenced most heavily by the big players. Sources within the U.S. feed industry tell us that its volumes have increased within the range of 1-1.3% over the past 12 months, in line with animal inventory changes at farm level. European feed federation FEFAC had said that compound feed production in the 27 countries of the European Union reached 149.8 million metric tons in 2007, or about 3.4% more than in 2006 — the highest annual growth rate in almost 20 years. First clues to 2008 tonnages in Europe have pointed to another 1% or so being added.
In European Union countries, says FEFAC, the evolution of compound feed volumes relates more closely to the development of poultry meat and egg production than to pork, because industrially made compounds enjoy a much higher market share against on-farm mixing in the poultry sector than in pig feeds. The comparison of 2007 with 2006 data for the EU-27 area had shown poultry feed output up by 2.6%, compared to 3.6% for pig feed production. There had been an even sharper 5.3% rise for cattle feeds, but this was after a bad year for the sector in 2006.
First news from China in 2008 had pointed to an increase close to 10% for the volume from Chinese mills in the early months of the year. But a slowdown in later months appears to have left annual output little changed from 2007. A commentary quoting data from the feed office of China's Agriculture Ministry has said the volume of compounds produced industrially in 2007 is thought to have included 50.9 million metric tons for poultry, over 24.1 million metric tons for pigs and about 12.9 million metric tons for aquaculture. The report put Guangdong first for size among Chinese provinces by registering a provincial total of 13.75 million metric tons. By comparison, Shandong was closest at 11 million metric tons, whereas no other province could claim an annual output above 7 million metric tons.
In third place for size on the world stage is Brazil. A forecast from Brazilian feed industry association Sindicato Nacional da Indústria de Alimentaçäo (Sindiraçoes) says a 10% increase in feed production has taken place there too, raising the 2008 total to 59.002 million metric tons from the 53.554 million metric tons that the association's data now shows for 2007.
Sindiraçoes calculates that dairy diets have led the way by registering a 14.4% rise, followed by 12.6% for layer feeds, some 11% for beef cattle rations and 10% for both broiler and aquafeed categories. The biggest slice of the market in Brazil in volume terms still goes to poultry, likely up from a 2007 level of 29.7 million metric tons to 32.87 million metric tons in association forecasts. Pig feed totals appear to have grown 7.9%, from about 14.2 million metric tons last year to slightly more than 15.3 million metric tons. This compares with the cattle feed market growth from 6.46 million metric tons to 7.32 million metric tons as dairy farms enjoy higher prices for their products and beef units increasingly put their animals into feedlots.
The association's account of influences in the past 18 months starts with corn prices, which hit R$36 for a 60-kilogram bag in the middle of 2007. It was what the U.S. would call eight-dollar corn, because the price worked out at the equivalent of about $8 per bushel. Since then, the quotation has eased appreciably, down as low as R$20 in the southern states of the country. But livestock farms in the meantime took the opportunity of fine-tuning formulations based on synthetic amino acids and making more use of enzymes to offset high mineral prices, according to Sindiraçoes.
It describes the financial crisis as forcing investments in new bio-ethanol plants to be postponed, affecting the corn demand picture, while a devaluation of the Brazilian Real has affected the effective local cost of imported feed materials priced in dollars. Most recently the main difficulty for feed-sector enterprises has seemed to be in obtaining credit facilities from banks or other lenders in order to pay for imports of raw materials. Feed industry leaders approached national banks for $300 million credit in order to import enough feed materials to give a guaranteed 90 days of supply.
Illustrating the problem in making any predictions for 2009, the association's directors offered two possible scenarios in respect to poultry-feed tonnage. One could be called the gloomy view, expecting no growth in production in the coming year due to depressed economic conditions. The other is much more upbeat by saying that an early bounce back for the global economy could see Brazil's poultry feed output growing by 5%.
Warm thanks from Feed Management to all the organizations and individuals who have helped compile this tonnage account for every national-feed industry of note. The regional shares of the world total calculated with their help appear in Figure 2. These shares demonstrate more than ever the three power-bases of feed manufacturing, with North-Central America, Europe and Asia each having almost one-third of the global tonnage last year.
Two top players stand out from the list in Table 1 of the 10 places we regard as having produced most industrial feed in the past 12 months. They are the U.S. and the European Union, treating the EU-27 as a single entity. See from the table that the combined output of the top 10 amounted to approximately 556 million metric tons. Although this is still over 79% of our estimated world total, it represents only a small growth from the 553 million metric tons accorded to the 10 largest feed producers 12 months ago. Evidently, the main expansion of 2008 was among the smaller players. Figure 3 underlines differences between the largest producers when it charts the evolution of feed manufacturing tonnages in several of these top territories over the last 10 years. China and Brazil stand out from the rest, on a scale where 100 on the index relates to the quantity they produced in 1998.
From Table 2, the commercial feed business in the European Union continues to be dominated by the trio of France, Germany and Spain. The U.K., Italy and the Netherlands follow closely behind. In the relatively mature market that is Europe, however, national volumes show only minor changes from year to year. The exceptions are places outside the European Union community, in the form of Russia and Turkey (Table 3).
Less growth is evident in the Americas, as seen by the numbers given for North and Central America in Table 4 and South America in Table 5, when compared to parts of Asia and some non-EU areas of Europe. Data on compounds production in Russia is still a matter of dispute among experts, who especially doubt that the output of the integrators is included sufficiently. By contrast, the feed industries of many Asian countries are well-documented. Table 6 indicates a number of hot-spots within the Asia-Pacific region. The mainly poultry marketplaces of the Middle East and Africa appear from Table 7 to have fared quite well in 2008.

.jpg?auto=format%2Ccompress&fit=crop&h=167&q=70&w=250)