Consumers are eating chicken more often in 2010, with the Millennial generation leading the way with the greatest frequency of consumption.
That’s according to a survey of 1,085 consumers sponsored by the National Chicken Council and funded by WATT PoultryUSA magazine and Givaudan Flavors Company.
Key survey findings
The survey measured at-home and away-from-home chicken eating frequency during a two-week period and asked respondents about their reasons for product preference. Key survey findings include the following:
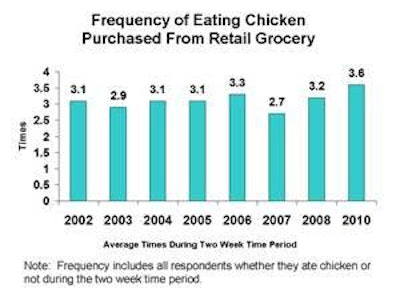
Chicken is more popular than ever with the average frequency of eating chicken at home being 3.6 times during a two-week period in 2010, the highest rate of any of the surveys since 2001.
- Away-from-home chicken eating, at 2.1 times, was the highest since 2001.
- Together, the at-home and away-from-home frequency of 5.7 times was significantly above previous years.
- The at-home market penetration, or share, in 2010 is 85%, slightly under the 87% high in 2006.
- The 67% share for away-from-home eating in 2010 did not reach the 69% share of 2004, the highest share in previous survey years.
- Combining at-home and away-from-home eating, 9 of 10 respondents ate chicken during the two-week period in 2010.
- Heavy chicken consumers – those eating chicken 4 or more times in a two-week period – totaled 62% in 2010, significantly higher than 53% in 2008.
Consumers were surveyed by PKS Research Partners in early June 2010. Respondents from a prescreened panel of consumers 18 years of age and older participated in the on-line survey. The sample was weighted to 1,000 respondents to reflect a demographic balance.
Generational group differences
Millennial households (ages 18 to 34 years) showed the highest frequency of chicken consumption when compared with other generational groups. Millennial consumers reported eating chicken purchased at retail grocery 4.6 times in two weeks compared to 3.6 times for all consumers. Similarly, Millennials’ frequency in eating chicken purchased at foodservice was 3.1 times compared to 2.1 times for all respondents.
Frequencies trended downward with age for the other generational groups, with the eating frequencies for Generation X consumers (ages 35 to 44 years) at 3.6 times for retail-purchased chicken and 2.2 times for foodservice-purchased chicken.
Boomers (45-64) reported chicken eating frequencies of 3.2 times for retail and 1.6 times at foodservice.
Greatest Generation (65-plus) consumers reported the lowest chicken eating frequencies at 2.6 for retail and 1.1 for foodservice.
Market penetration by generation
A similar pattern in household penetration (share) was reported for the four generational groups, with Millennials registering the highest shares (90% at-home and 80% away-from-home) followed by Generation X (86/71), Boomers (83/61) and the Greatest Generation (79/50).
Frequency and share by demographic group
Hispanic and black consumers reported eating chicken significantly more often in the two-week period than white consumers. The combined at-home and away-from-home eating frequencies were 6.9 times for Hispanic respondents and 6.3 times for black respondents. The combined frequency for white consumers was 3.4 times.
Hispanic consumers and black consumers also had the highest share of eating chicken during the two-week period, each at 92%. The share for white consumers was 89%.
Why consumers prefer chicken
Respondents reported that they prefer to purchase chicken rather than other meat/poultry for a number of reasons. Chicken’s versatility – ability to be cooked in many ways – was the top reason in 2010 with more than 9 out of 10 respondents indicating this as the reason for their preference. This reason was followed by convenience and ease of preparation (89%), healthfulness (86%) and more economical (82%).
Compared with the 2002 survey, which was the previous time respondents were questioned about purchase reasons or product attributes, the most significant change in reason for preference was the higher rating given to “tastes better.” In 2002, “tastes better” ranked last in the list of 10 reasons but climbed to sixth place in 2010.
Preferences based on eating frequency, generation
As might be expected, consumers eating chicken most frequently (4-plus times in two weeks) rated the reasons for preference consistently higher than consumers eating chicken 2 to 3 times or only 1 time.
Consumers who reported eating chicken only once in the two-week period did not perceive chicken to be as economical as the other consumers. Taste, tenderness and quality/wholesomeness also were rated somewhat lower by these consumers compared with other respondents.
From a generational perspective, there are a number of noticeable differences in why the four generational groups purchase chicken. Older consumers reported favoring chicken’s versatility and economic value more so than the Millennials. Similar responses were received for “low in fat.” On the other hand, Millennials ranked taste somewhat higher than the Greatest Generation consumers.
Share of consumers eating chicken at home
The household penetration of eating chicken purchased at supermarket/retail grocery increased in 2010 when compared to the 2008 and 2007 surveys. Although the 85% share of respondents reporting eating chicken from a supermarket during the two-week period was not as high as the 87% found in 2006, the 2010 share ranks as the second highest since 2001.
‘Away from home’ share
A four-point increase in household penetration for foodservice chicken was reported for 2010 when compared with 2008. Two-thirds of consumers purchased chicken at foodservice in 2010, reversing a downward trend reported in 2007 and 2008. The 2010 results compare with the same penetration rate reported in 2006, 2005 and 2002.
Combined ‘at home’ and ‘away from home’ shares
An increase in combined household penetration for supermarket and foodservice chicken was reported for 2010 compared with 2008. Nine of 10 households eating chicken from retail grocery and foodservice were also reported in 2005 and 2002.
Purchases at supermarket/retail grocery
Chicken purchased from a supermarket/grocery food store was eaten on average, 3.6 times in two weeks, including respondents who said they ate no supermarket-purchased chicken during the period, while the average increases to 4.2 times excluding non-chicken eaters. Respondents who indicate they did not eat chicken purchased from a supermarket/grocery store in the two weeks represented 15%, significantly better when compared with the share of non-eaters in 2008 (23%).
Respondents who ate chicken from retail grocery stores 2 or 3 times in two weeks are categorized as medium chicken eaters. The medium group totaled 32%, the same percentage as in 2008.
Consumers eating chicken from supermarkets/grocery stores 4, 5, 6, 7, 8 or more times in two weeks are classified as heavy chicken eaters. Heavy chicken eaters accounted for 42% of the total number of respondents compared with 35% in 2008. The increase in heavy eaters from 35% to 42% represents a significant shift in consumption since heavy eaters account for the majority of chicken consumption.
Frequency of eating chicken purchased from foodservice
Respondents ate chicken purchased at restaurants, fast food stores or employee cafeterias, and similar foodservice operations an average of 2.1 times during two weeks, including non-eaters of foodservice chicken. Excluding non-chicken eaters raises the average to 3.1 times during two weeks. By comparison, in 2008 the frequencies for these two measures were 2.0 and 3.2, respectively.
The share of consumers not eating foodservice chicken during the two weeks was 33% compared with 37% in 2008.
The percentage of light chicken eaters, 19% in 2010, is the same as in 2008.
Twenty-nine percent of respondents ate foodservice chicken 2 or 3 times during two weeks (medium eaters of foodservice chicken) in 2010 compared with 25% in 2008.
Heavy consumers of chicken at foodservice – those who ate foodservice chicken 4, 5 or more times during two weeks – accounted for 19% of the respondents in 2010. This share is somewhat comparable to the 18% found in 2008.
Retail grocery and foodservice combined
Combining responses for eating chicken purchased from supermarket/retail grocery food stores and restaurants/foodservice establishments presents a somewhat different picture than looking at each market channel individually. Consumers ate chicken 5.7 times during two weeks when all respondents are included and 6.3 times when non-chicken eaters are excluded.
These rates are above the 2008 rates of 5.2 times and 6.1 times, respectively.
One of 10 respondents ate no chicken in the two weeks compared with 15% in 2008. Once-in-two-weeks eaters (light consumers) were 7% in 2010 compared with 9% in 2008.
Medium chicken eaters (2 or 3 times) accounted for 21% of respondents in 2010, somewhat the same as the 22% in 2008. Consumers who ate chicken 4 or more times during two weeks (heavy eaters) totaled 62% in 2010, significantly higher than the 53% in 2008. The 62% compares with 42% for heavy supermarket chicken eaters and 19% for heavy foodservice chicken eaters.